Statistics
The Statistics page centralizes the extension’s activity in the active workspace. Counters are scoped per workspace; switching workspace immediately swaps the figures.
It is split into four sub-pages that you browse via the tab bar at the top of the page: Summary, Rules, Sessions, and Storage. Each sub-page has its own deep link (#stats, #stats/rules, #stats/sessions, #stats/storage) and the active sub-page appears in the header breadcrumb.
Summary
Section titled “Summary”The landing view gathers the headline indicators plus a look at the week.
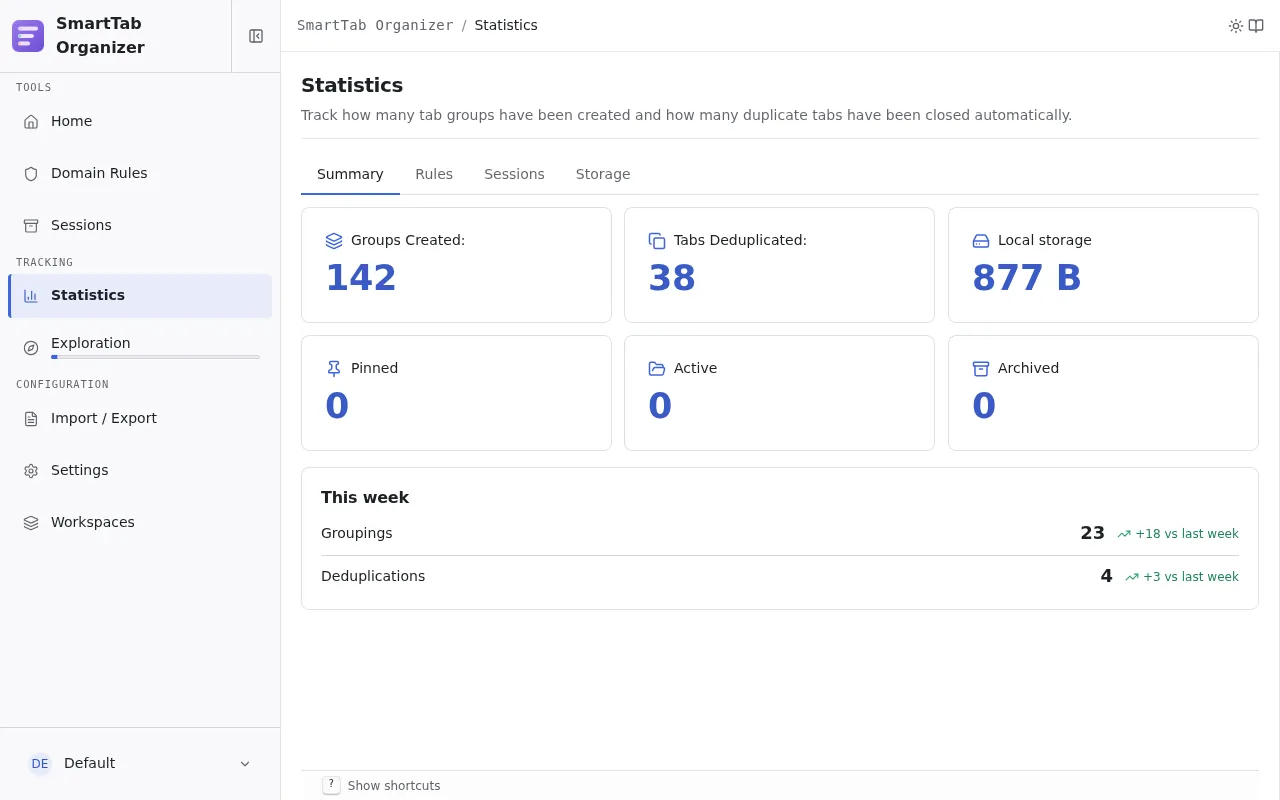
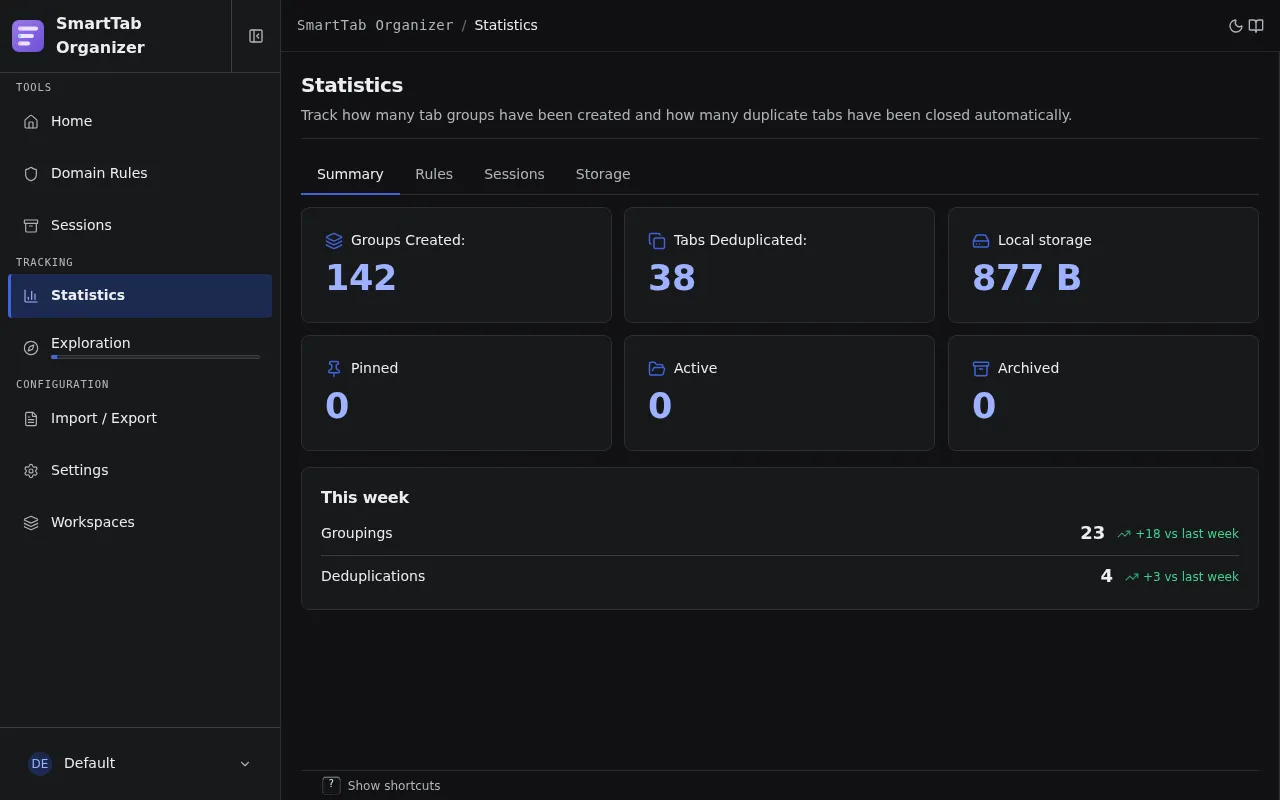
Six headline tiles:
- Groups Created: cumulative total of Chrome groups created.
- Tabs Deduplicated: cumulative total of duplicates closed.
- Local storage: total size used in local storage.
- Pinned, Active, Archived: number of sessions per bucket.
Below, the This week block compares the current week’s activity with the previous one, across two series (Groupings and Deduplications) each carrying a small trend badge.
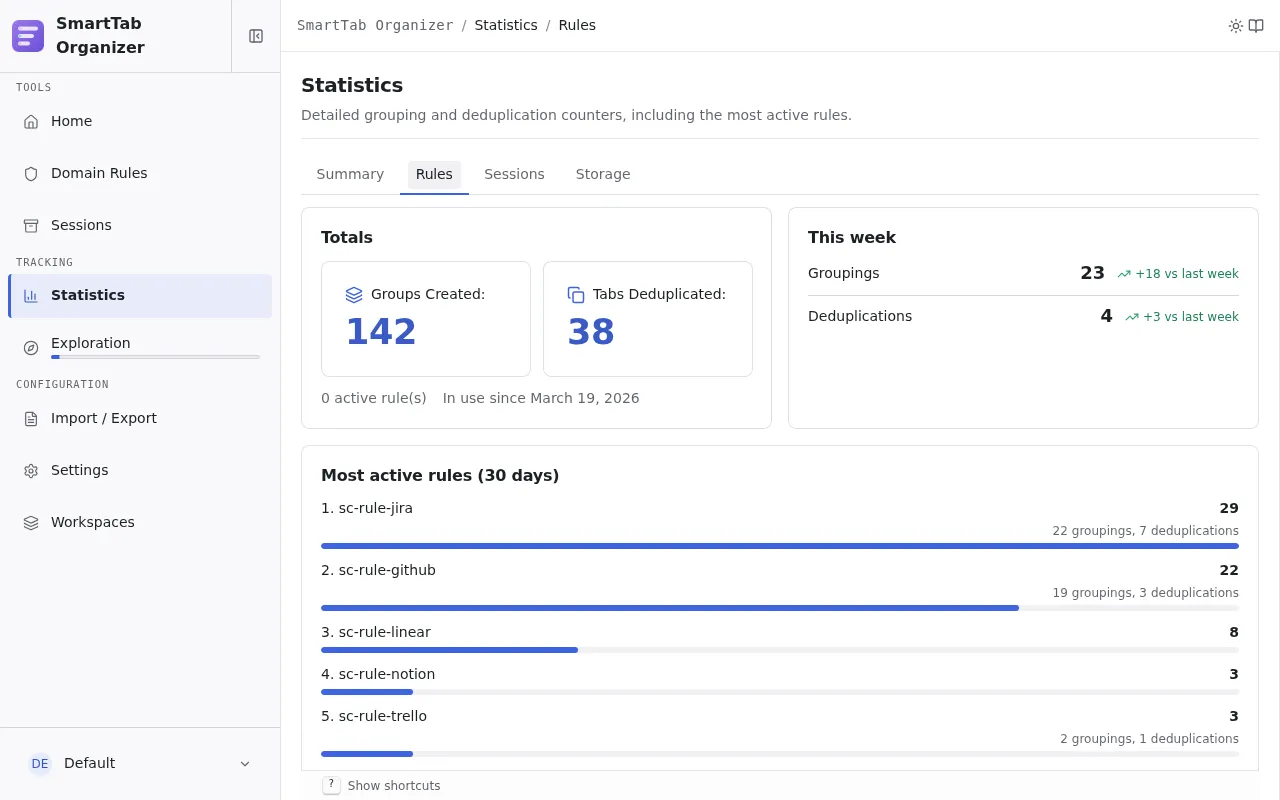
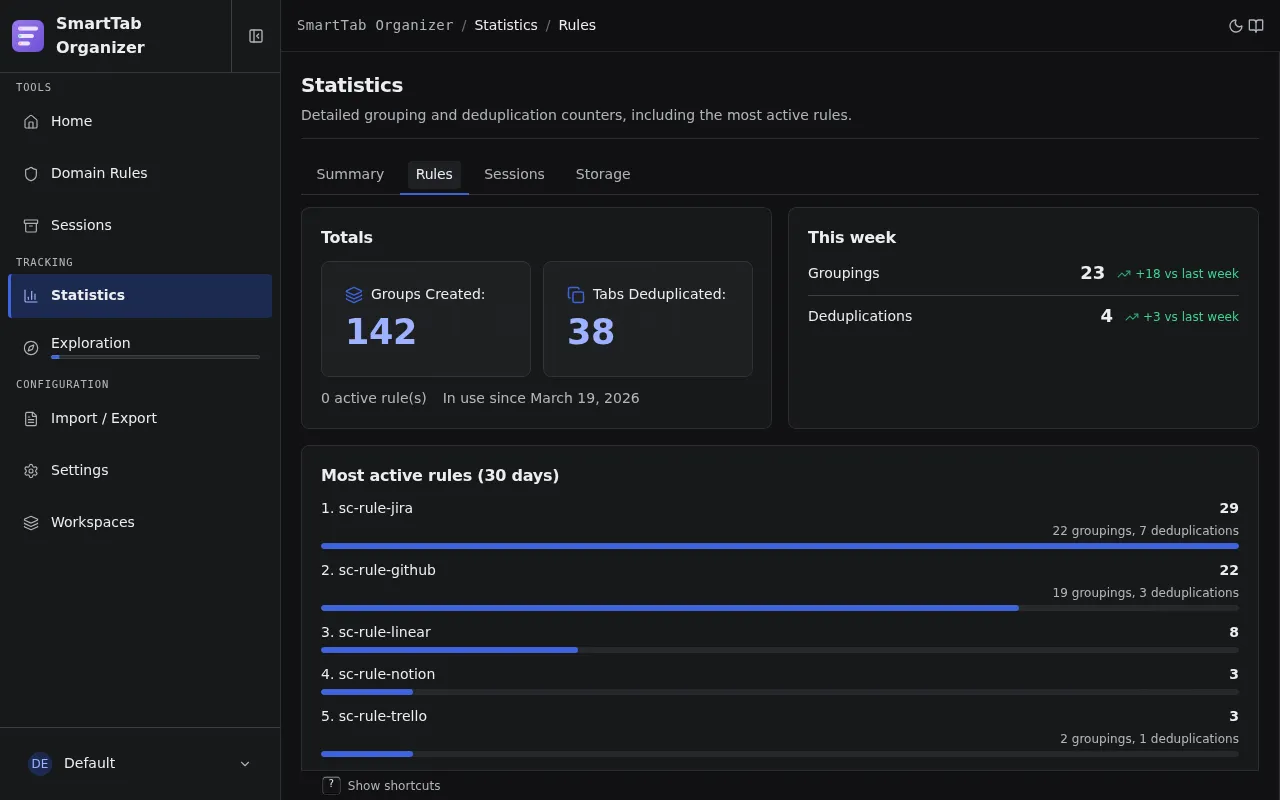
The detail of grouping and deduplication activity.
Totals
Section titled “Totals”Two counters cumulated since first use:
- Groups Created: incremented every time a new Chrome group is created. Joining an existing group does not count.
- Tabs Deduplicated: incremented every time a duplicate is closed. An Undo via the notification button decrements the counter.
Below, two contextual indicators: the number of active rules and the in use since date.
This week
Section titled “This week”Compares the current week’s activity with the previous week: Groupings (groups created) and Deduplications (duplicates closed). The delta (+15 vs last week, for example) shows the change against the prior week.
Most active rules (30 days)
Section titled “Most active rules (30 days)”A ranking of rules by event volume (groupings + deduplications) over the past 30 days. Useful to spot the rules pulling their weight and the ones that have gone dormant and could be cleaned up.
Reset the counters
Section titled “Reset the counters”The Reset Stats button at the bottom of the Rules sub-page zeroes every counter of the active workspace. A confirmation is requested. This action affects neither rules, nor sessions, nor settings: only the counters are wiped.
Sessions
Section titled “Sessions”All the metrics tied to your sessions.
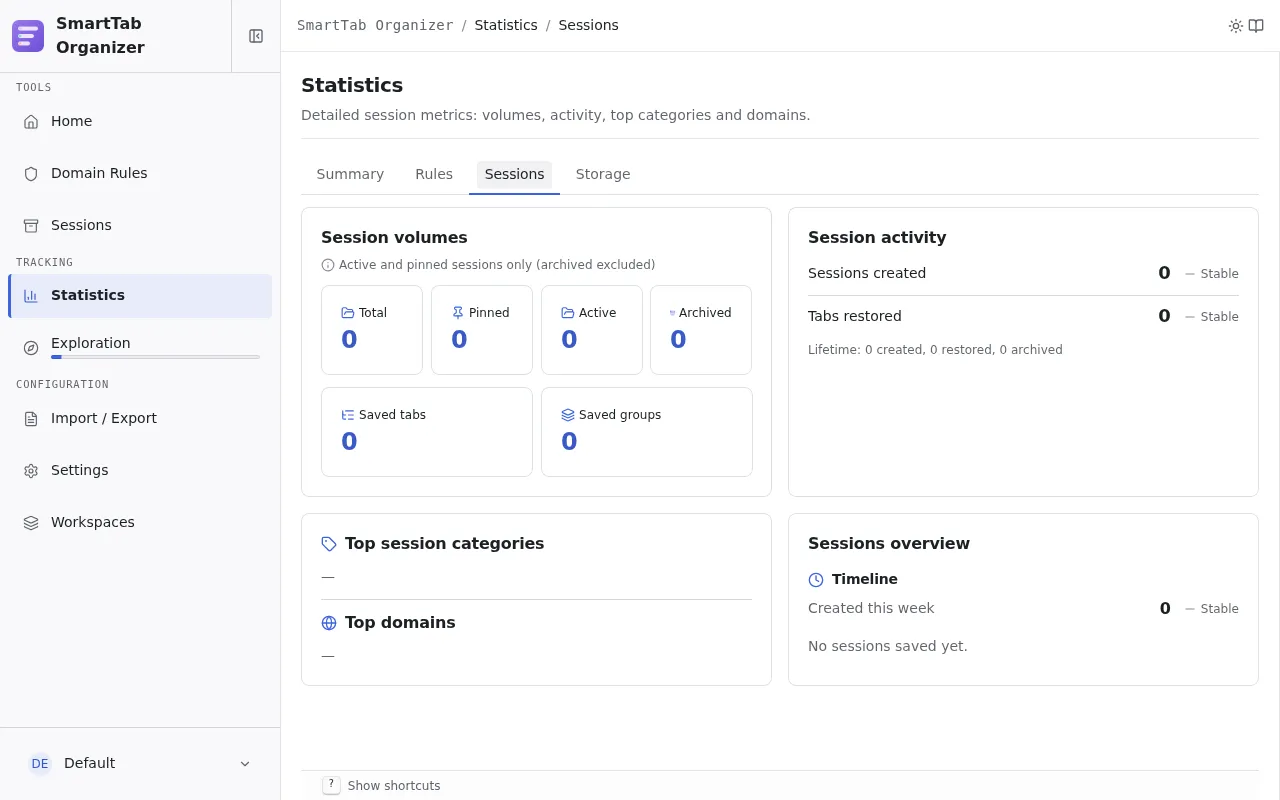
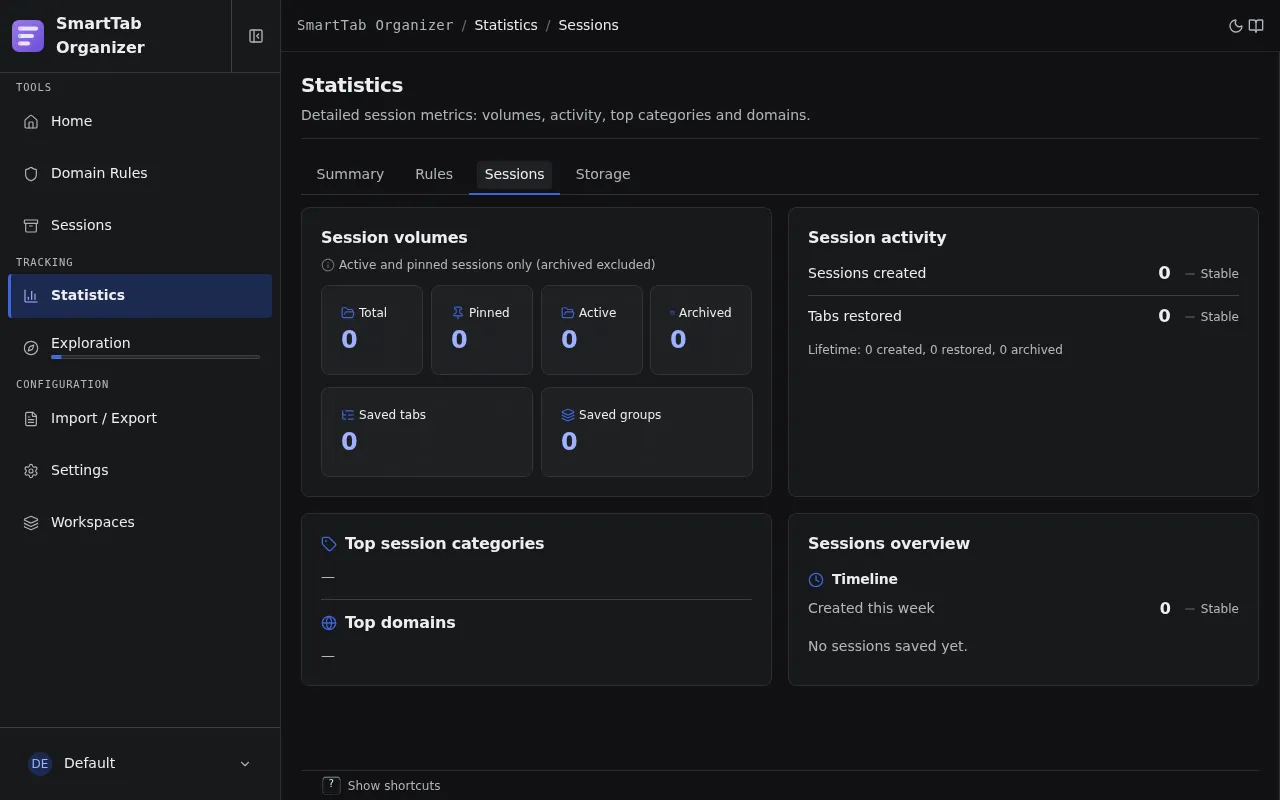
Session volumes
Section titled “Session volumes”Sums up the current state of your sessions, archives excluded by default:
| Tile | Content |
|---|---|
| Total | Active + pinned sessions. |
| Pinned | Profiles shown in the popup and on the home page. |
| Active | Ordinary unpinned sessions. |
| Archived | Archived sessions (see Sessions, archive). |
| Saved tabs | Sum of tabs contained in active and pinned sessions. |
| Saved groups | Sum of Chrome groups contained in the sessions. |
Under the tiles, three qualitative indicators: average tabs per session, the largest session, and the percentage of sessions with a category and the percentage with a note.
Session activity
Section titled “Session activity”Two weekly counters on actions taken:
- Sessions created: how many snapshots you captured this week.
- Tabs restored: how many tabs were opened from a session.
Each one carries a small trend badge (up, down, stable) compared to the previous week. A Lifetime subtitle restates the historical totals for sessions created, restored, and archived.
Categories and domains
Section titled “Categories and domains”- Top session categories: distribution of your sessions by category. A dash when no session has a category assigned.
- Top domains: a ranking of the domains that appear the most in your saved sessions.
Sessions overview
Section titled “Sessions overview”Three complementary mini-views:
- Timeline: the oldest session and the most recently updated one, plus the number of sessions created this week.
- Group color distribution: a horizontal histogram aggregating the Chrome group colors across all sessions.
- Largest sessions: top sessions by tab count.
Storage
Section titled “Storage”The detail of the space used in the browser’s local storage.
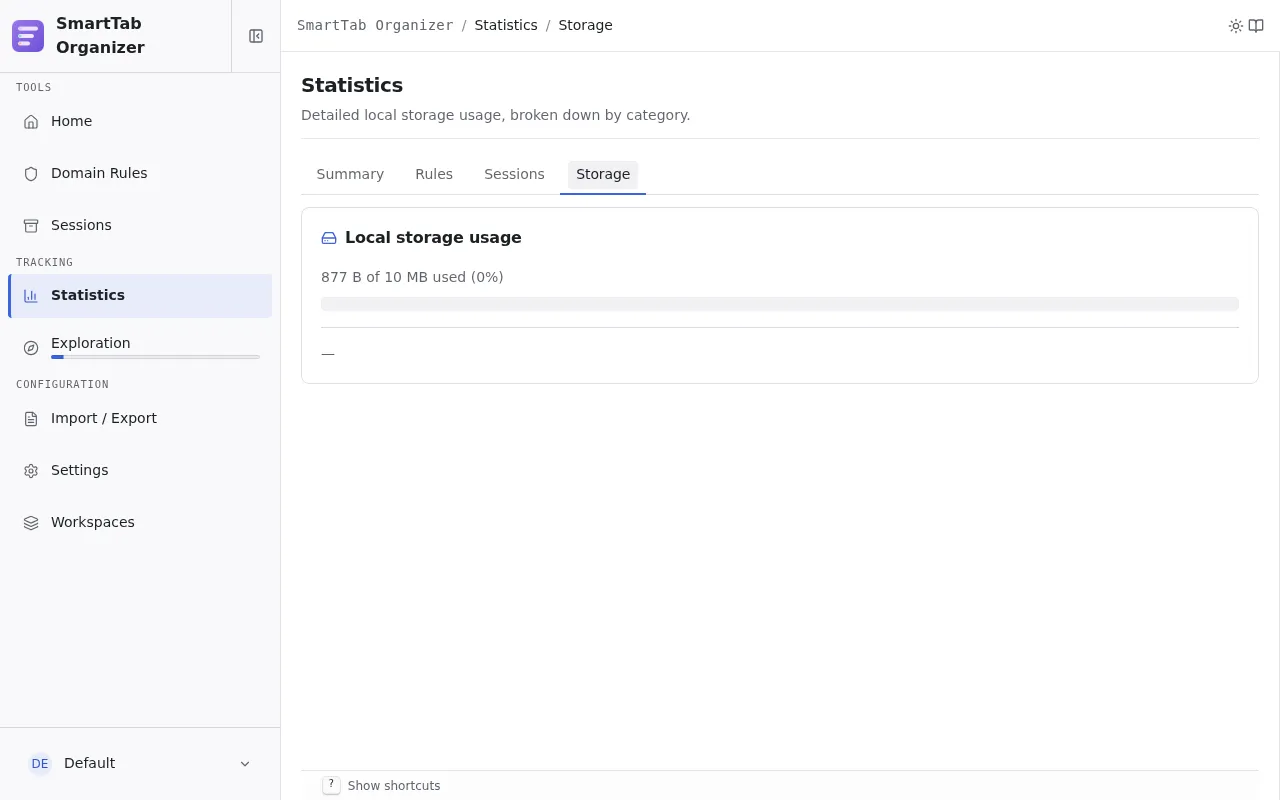
A quota bar shows the share used against the browser’s allowed maximum. Below, the footprint is broken down by category: domain rules, active sessions, pinned profiles, archived sessions, statistics, and miscellaneous settings.